Overview
PhyloFlask
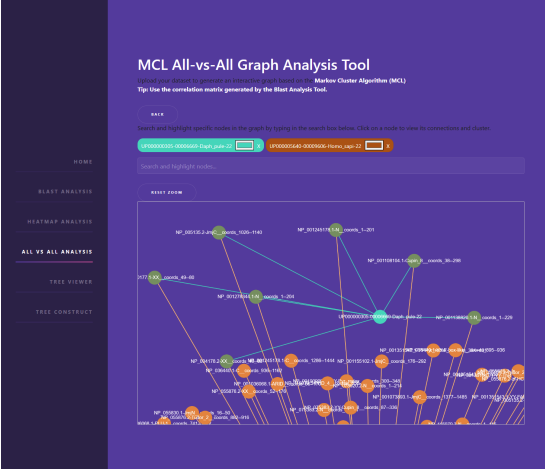
A software framework for large-scale phylogenetic profile visualization
Image
Summary
The explosive growth of biological data, primarily due to advances in next-generation sequencing (NGS) technologies, has created a pressing need for efficient tools for analysis, visualization, and summarization. Managing this data requires specialized methods to understand genetic patterns and functional interactions between species. This work aims to develop an integrated tool for the analysis of large-scale genomic data, based on modern visualization techniques and modeling of relationships between species and structural protein domains. The developed system processes BLASTp files and extracts information related to the presence and absence of structural protein domains. The data is organized into correlation tables and feature matrices, enabling comparative analysis between different species. Using these tables makes it possible to identify patterns and relationships that are not immediately apparent from simple sequence analysis. A key feature of the system is its interactive analysis capability through advanced visualizations. Libraries such as Dash, Plotly, D3.js, Echarts, and Cytoscape.js were used, allowing users to explore the data in real time. These dynamic visualizations enable customization of appearance parameters and provide a better understanding of the data for researchers without programming experience. The data analysis was further enhanced using network techniques and clustering algorithms. Specifically, Markov Clustering (MCL) was applied to group species based on their functional similarity. The graph resulting from data processing is stored as a Compressed Sparse Row (CSR) matrix, significantly reducing storage and computational costs. Python with Flask was chosen for backend development due to its flexibility and ability to integrate multiple data analysis libraries. The application structure allows both user interface interaction and command-line use, providing flexibility to researchers depending on their preferences and experience level. The platform’s design ensures that even large datasets can be efficiently loaded and analyzed without the need for specialized hardware. The platform was evaluated using real genomic data provided by the BCCB laboratory of Aristotle University of Thessaloniki. During the evaluation process, the system demonstrated 9high efficiency in handling large datasets while offering interactive capabilities that enhance data understanding. Additionally, collaboration with experts such as Dr. Christos Ouzounis contributed to the further improvement of the tool and the validation of its scientific value. This work provides an important tool for genomic informatics, facilitating the study of biodiversity and evolutionary relationships between species. The system’s flexibility and userfriendliness make it ideal for researchers who wish to process and visualize large genomic datasets easily and efficiently. In the future, the tool can be expanded to support additional functionalities, such as metabolic network analysis and the integration of machine learning for discovering new evolutionary relationships.
5
0


0
%
Growth
0
%
Growth
0
%
Growth